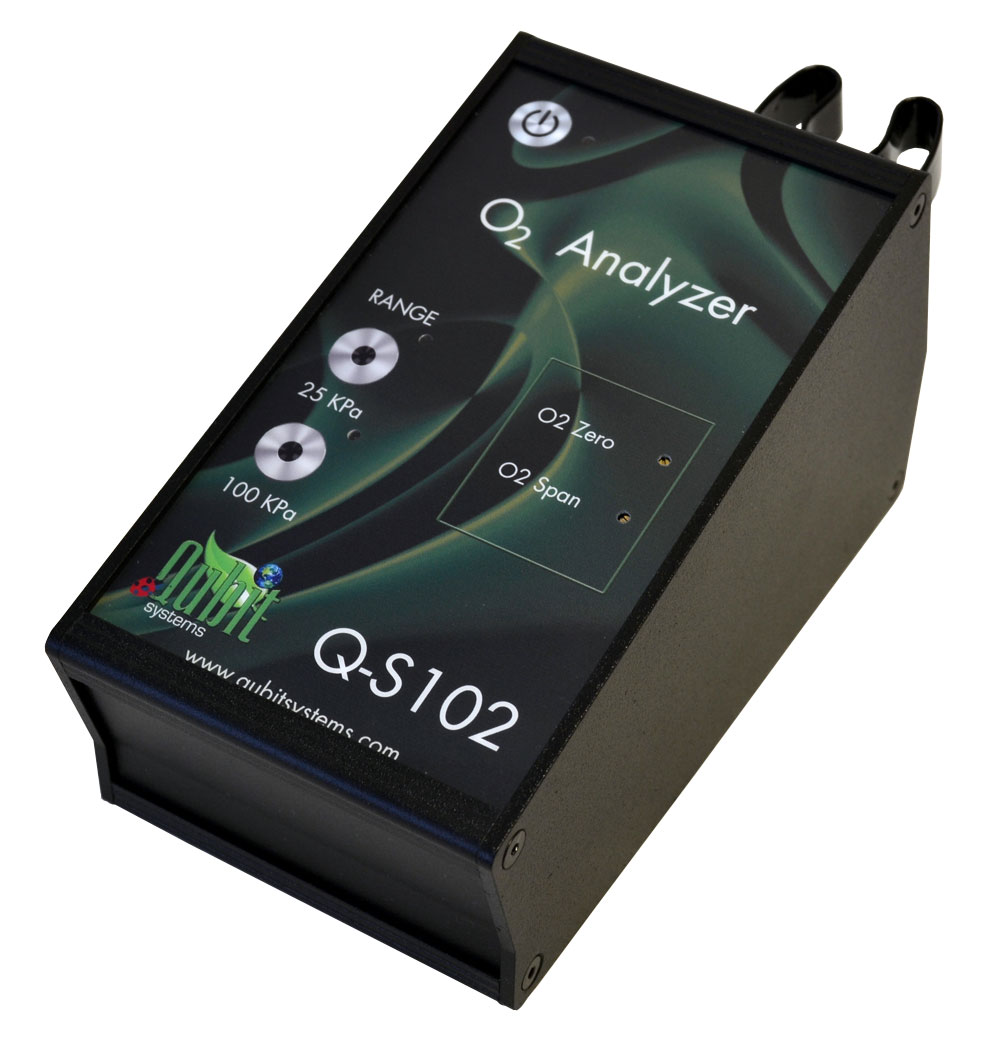
Qubit Systems’ Q-S102 O2 Analyzer is configured for measuring oxygen concentration in a flow through gas exchange systems in 0-25% or 0-100% range with 0.21% accuracy. The O2 Analyzer also contains gas pressure sensor for measurements of total gas pressure at the O2 sensor. The Q-S102 O2 Analyzer is ideal for determining O2 uptake in organisms with high metabolic rates in an open flow system configuration. For organisms with low metabolic rate it can be used in a closed flow system where the rate of O2 uptake can be calculated from the slope of O2 decline in the system.
The Q-S102 O2 analyzer requires data interface with two analog signal ports and software to operate. We recommend our C610 LabQuest Mini data interface with C901 Logger Pro Software. Q-S102 has been developed from the S102 Flow Through O2 Sensor and is a key component of the Q-Box Packages for research. The Q-S102 O2 Analyzer has a galvanic cell (a lead-oxygen battery) consisting of a lead anode, an O2 cathode, and an acid electrolyte. It also incorporates an O2-permeable Teflon FEP membrane with a gold electrode bonded to its surface. Oxygen diffusing through this membrane is reduced electrochemically at the gold electrode. A resistor and thermistor (for temperature compensation) are connected between anode and cathode. The output of the instrument is proportional to the current flowing through the resistor and thermistor and this is proportional to pO2 in contact with Teflon membrane.
- Switchable ranges of 0 – 25 kPa and 0 – 100 kPa O2
- built in gas pressure sensor
- galvanic cell technology
- 0 – 5 V analog output at both range settings
- Optional battery pack for field use
- Compact and portable
Applications
- Animal Respirometry
- Human Respirometry
- Atmospheric monitoring and Control
| Operating principle | Acid Electrolyte, Teflon Diffusion Membrane |
| Detection Range | 0-25% and 0-100 %O2 (Linear) |
| Resolution | ±40 ppm |
| Accuracy | ± 0.21% of Full Scale |
| Response Time (90%) | 12 Seconds |
| Calibration | Two point |
| linear response | |
| Life Expectancy of sensor | 3-5 years |
| Easy sensor replacement (Qubit offers replacement sensors) | |
| Influence by Other Gases | Ammonia and Ozone |
| CO2 friendly sensor | |
| min flow | 5 mL/min |
| max flow | 650 mL/min |
| Built in total gas pressure reading at the O2 sensor (for pressure correction in the software) | |
| Pressure Range | 0.5 atm to 1.5 atm |
| Pressure Effect | Output voltage changes proportionally |
| Shock Resistant | to 2.7 G |
| Avoid strong vibration | |
| Operating Temperature | 5 to 40oC (Effective range) |
| Passive temperature control of the O2 sensor | |
| Weight | 1.35 kg |
| Dimensions (cm) | (H x W x D: 5.5 to 9.5 x 9.5 x 17) |
| Output | 0 to 5 volt |
| Two ranges | 0-25kPa, 0-100kPa |
| Power Supply | 12 Volts |
- Sadie B. Barr and Jonathan C. Wright. Postprandial energy expenditure in whole-food and processed-food meals: implications for daily energy expenditure. Food Nutr Res. Vol 54 (2010).
- Shannon M. Fernando, Pengcheng Rao, Lee Niel, Diptendu Chatterjee, Marijana Stagljar andD. Ashley Monks. Myocyte Androgen Receptors Increase Metabolic Rate and Improve Body Composition by Reducing Fat Mass. Endocrinology Vol. 151, Number 7, p3125-3132 (2010).
- T. Todd Jones, Richard D. Reina, Charles-A. Darveau and Peter L. Lutz. Ontogeny of energetics in leatherback (Dermochelys coriacea) and olive ridley (Lepidochelys olivacea) sea turtle hatchlings. Comparative Biochemistry and Physiology – Part A: Molecular & Integrative Physiology Vol 147, Issue 2, p313-322 (2007).
- R.Refinetti. Absence of circadian and photoperiodic conservation of energy expenditure in three rodent species. Journal Of Comparative Physiology B: Biochemical, Systemic, And Environmental Physiology Vol 177, Number 3, p309-318 (2007).
- Edwin R. Price, Frank V. Paladino, Kingman P. Strohl, Pilar Santidrián T., Kenneth Klann and James R. Spotila. Respiration in neonate sea turtles. Comparative Biochemistry and Physiology, Part A Vol 146, Issue 3, p422–428 (2007).
- David Nestel, Esther Nemny-Lavy, Sheikh Mohammad Islam, Viwat Wornoayporn and Carlos Cáceres. Effects Of Pre-Irradiation Conditioning Of Medfly Pupae (Diptera: Tephritidae): Hypoxia And Quality Of Sterile Males. Florida Entomologist Vol 90 Number 1, p80-87 (2007).
- Muleme HM, Walpole AC and Staples JF. Mitochondrial metabolism in hibernation: metabolic suppression, temperature effects, and substrate preferences. Physiol Biochem Zool. Vol 79, Number 3, p474-83 (2006).
- Tammy Chan and Warren Burggren. Hypoxic incubation creates differential morphological effects during specific developmental critical windows in the embryo of the chicken (Gallus gallus). Respiratory Physiology & Neurobiology Vol 145, Issues 2-3, Pages 251-263 (2005).
- Tapio Eeva, Esa Lehikoinen, and Mikko Nikinmaa. Pollution-Induced Nutritional Stress In Birds: An Experimental Study Of Direct And Indirect Effects. Ecological Applications Vol 13, Issue 5, p1242–1249 (2003).
- Frances D. Duncan and Marcus J. Byrne. Respiratory airflow in a wingless dung beetle. The Journal of Experimental Biology Vol 205, p2489–2497 (2002).
- C. J. Bernacchi, E. L. Singsaas, C. Pimentel, A. R. Portis Jr and S. P. Long. Improved temperature response functions for models of Rubisco-limited photosynthesis. Plant, Cell & Environment Vol 24, Issue 2, p253–259 (2001).
- Q-Box RP1LP Low Range Respiration Package,
- Q-Box RP2LP High Range Respiration Package,
- Q-Box NF1LP Nitrogen Fixation Package
- Q-Box HR1LP Human Respirometry Package.